In a recent study published in the Current Developments in Nutrition Journal, researchers investigated store checkout food and beverage setups.
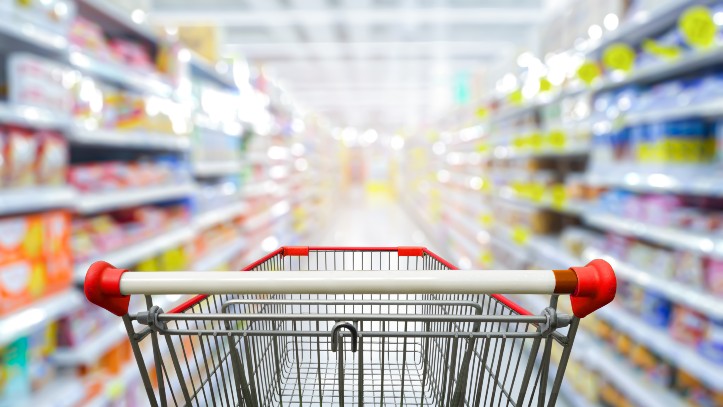
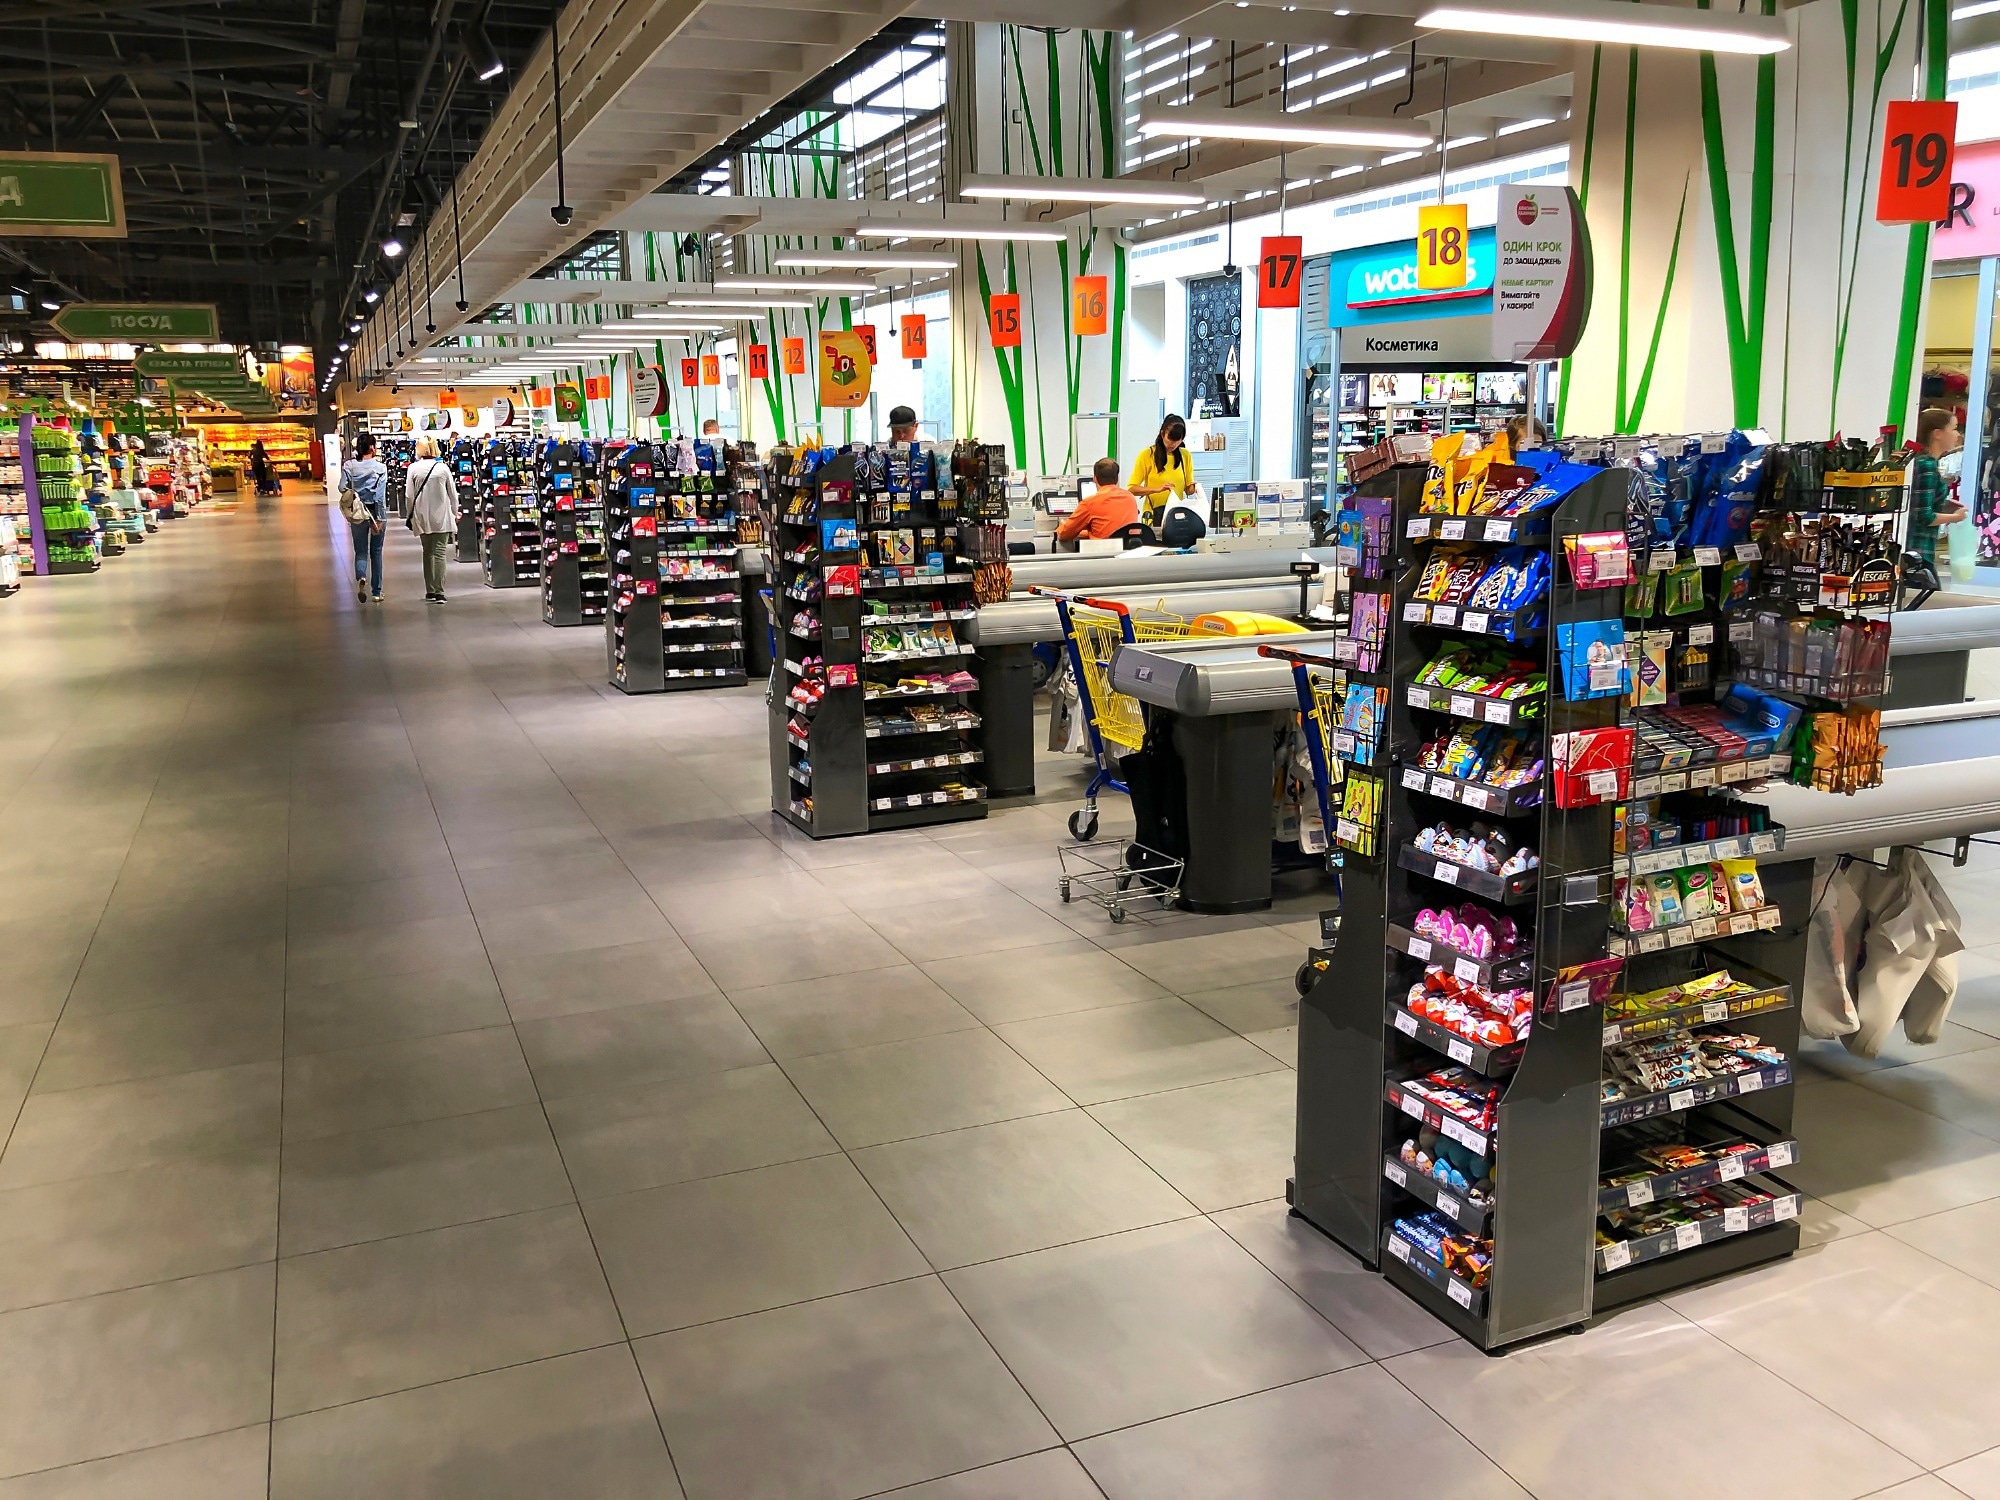 Study: Food and beverage environments at store checkouts in California: Mostly unhealthy products. Image Credit: Dmitrydesign/Shutterstock.com
Background
Consumption of added sodium, sugar, and ultra-processed foods in the United States (US) is high among children and adults, which increases the likelihood of developing heart disease, type 2 diabetes, and other health conditions at the population level.
The retail food environment is crucial for enhancing diet quality in the United States, as stores supply most of the food and drinks consumed.
A store’s checkout area can significantly impact consumer choices as it is the only place customers must cross and is known to stimulate impulse purchases. Assessing checkout policy requirements requires a clear understanding of the current condition of checkout environments.
About the study
In the present study, researchers categorized product facing checkout in food stores located in California.
The study analyzed the checkout environment of 102 food stores in Berkeley, Davis, Oakland, and Sacramento. The study focused on a census of Berkeley stores recognized by policy proponents as subject to the Healthy Checkout Ordinance (HCO) during policy development and was functional in February 2021.
All chain specialty food stores, supermarkets, mass merchandisers, chain drugstores, two of three dollar stores, and independent grocery stores larger than 2,500 sq ft were included across the city.
Trained data collectors utilized the Store CheckOut Tool (SCOUT) to observe and evaluate checkouts’ food and beverage state. Detailed and contextual photos were taken by data collectors of every product facing in sampled checked out areas to document their characteristics.
The assessment was conducted on each facing individually, even if there were several facings for the same product. Data collectors recorded information on each product facing a maximum of three checkouts per store.
The products were categorized and arranged based on their healthfulness. The categories consisted of non-food or beverage items and foods and beverages that are major sources of added sodium or sugar in the American diet, including sugar-sweetened beverages (SSBs), sweets, salty snacks, and candy.
Other food and beverage groups included: fruits and vegetables, legumes, nuts and seeds, water, milk, diet beverages, 100% juice, yogurt, cheese, trail mix, and bars.
Results
Of 39,231 checkout facings, almost 12,476 included non-food/beverage facings, while 26,755 included food and beverage. Approximately 80% of the facings were food, while the remaining 20% were beverages.
The register and lane area was the most common location for checkout food and beverage facings, followed by checkout endcaps, snacking checkout area, and standalone displays.
The most common food and beverage groups were candy, SSBs, gum, mints, sweets, salty snacks, and diet beverages. The less frequent items were healthier choices such as water, fruits and vegetables, nuts and seeds, milk, and legumes.
Most beverages found were classified as SSBs, with soda being the most common, followed by sweetened teas, coffee, and energy drinks. Diet drinks were the second most common category among all facing beverages, with water closely behind.
About 30% of food and beverage facings fulfilled the healthy checkout standards across all checkout locations. The most common categories were gum and mints with no added sugars, nuts, fruits, unsweetened beverages, seeds, and whole grains.
However, vegetables, cheese, yogurt, or legumes were included in less than 1% of these facings. Candy was the most common food and beverage item that did not meet healthy checkout standards, followed by SSBs, sweets, salty snacks, and diet beverages.
The other categories comprised less than 4% of the items that did not meet the standards. Many food and beverage facings also did not meet the healthy checkout standards when limited to snack-sized packages with at least two servings per package.
The highest proportion of food and beverage facings that fulfilled the healthy checkout standards was found in specialty chain food stores, chain mass merchandisers, and chain supermarkets, while the lowest proportion was observed in independent grocery stores and chain dollar stores.
There were considerable comparative variations between these store groups. Chain supermarkets were more likely to fulfill healthy checkout standards than chain drugstores and independent supermarkets. Chain drugstores had a remarkably lower likelihood of fulfilling healthy checkout standards than chain supermarkets.
Conclusion
The study findings showed that most food and beverage facings observed at checkout in food stores were high-sodium or high-added-sugar products such as SSBs, candy, salty snacks, and sweets.
Checkout displays contained a small percentage of water and fruits/vegetables among food and beverage products.
The study highlights the significance of implementing healthy checkout policies across various store types, which should encompass the snacking area and checkout endcaps.


0